

Updated on 21 Jun 2024: Added “Using Automation Center (preview)
There are several methods to monitor your cloud flows, whether from Microsoft or from other companies and developers. In this article I will talk about a few of them.
1. Using Automation Center (preview)
Since a few weeks, Microsoft has released a preview of Power Automate’s Automation Center. This dashboard already offers some useful features regarding the monitoring of cloud flows.
You do need to enable this feature within the Admin Center, see this article.
Overview screen
The first screen shows an overview of all the flow runs with some nice graphics.
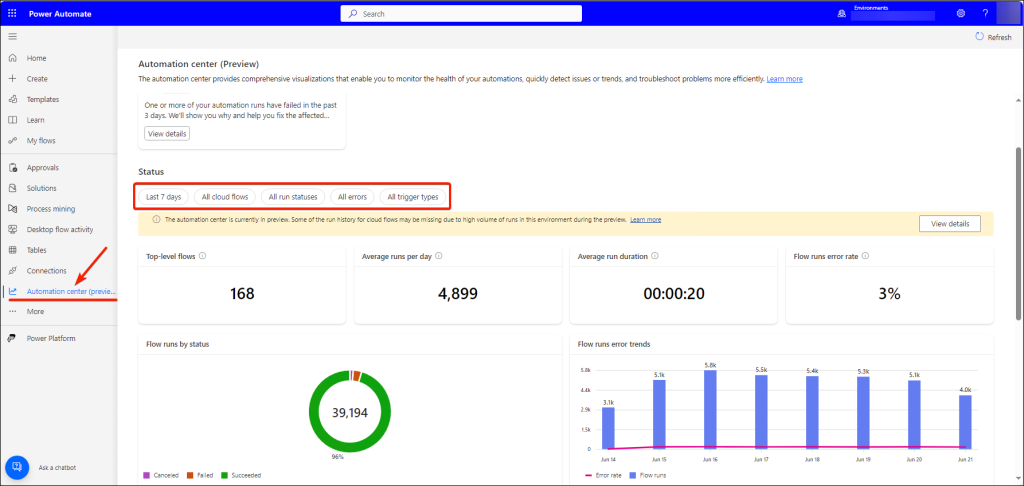
There are several buttons which allows you to filter on:
- a specific date and time period, custom period also allowed;
- zoom in on specific flows, search and select flows;
- statuses to focus on, of which Failed would be the most obvious;
- some fixed type of errors;
- trigger types.
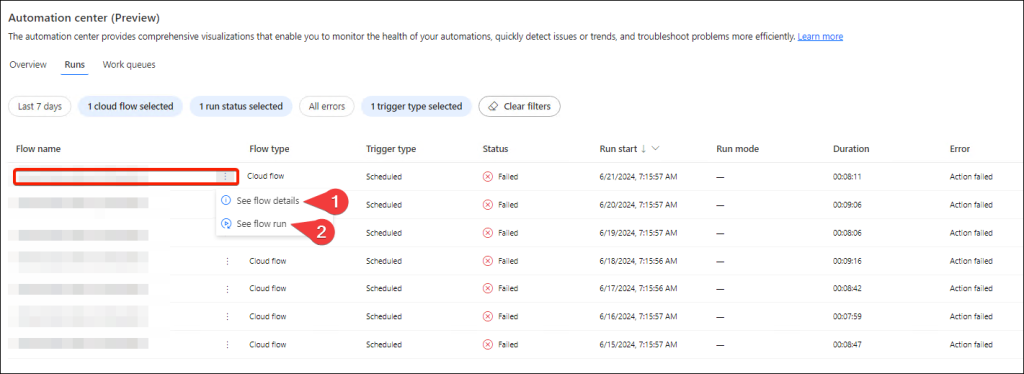
Flow runs screen
The second screen shows the flow runs which adhere to the filters set, so you’re able to view which runs are e.g. failing. Sorry for blurring the names of the flow. 😉
Clicking on the context menu, you have the option to (1) go to the details of the flow, or (2) jump straight to the failing run. This is exactly what we want. Alas, the actual error is not available within this view, you still need to go to the run.
There is also a third screen “Work queues”, which is useful for environments that use those. I am not.
2. Using Power Automate Analytics
In the Power Platform Admin Center, you will find a section for Analytics with a subsection for Power Automate. It will show you runs, usage, and errors for Cloud flows and Desktop flows. This article will show some examples how that looks.
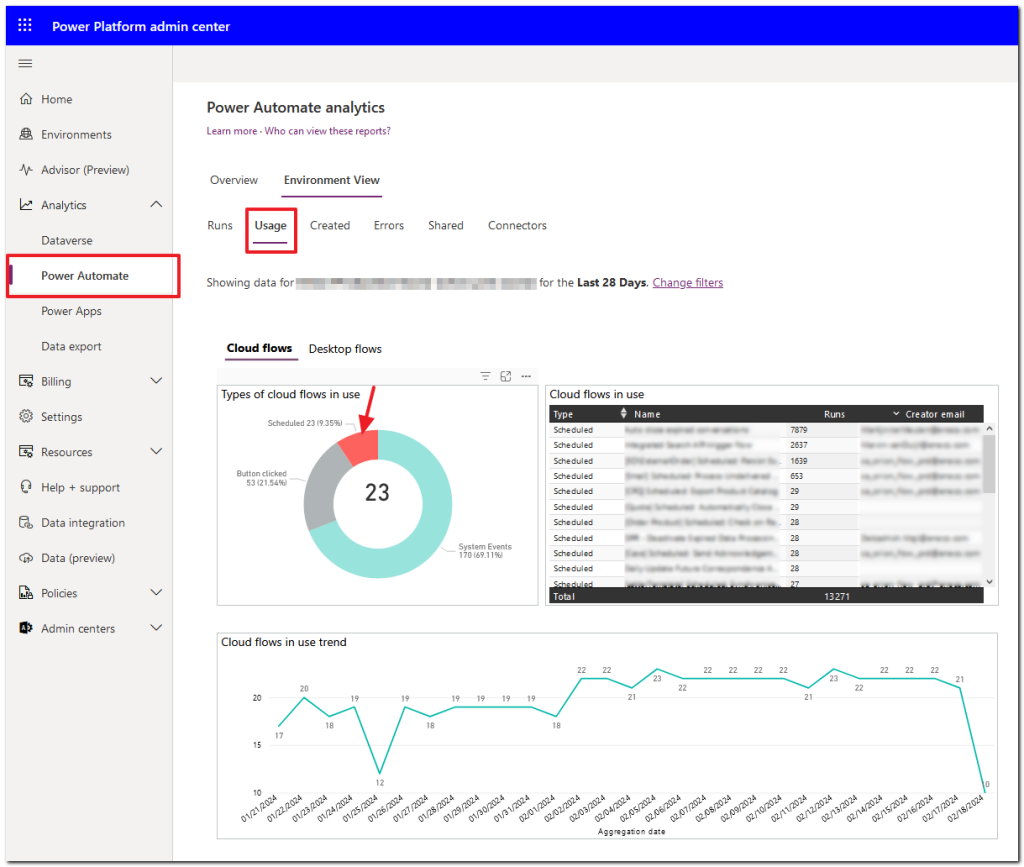
Cloud flow usage
Under the Usage tab, you can focus on a specific type of Cloud flow. In this example I selected “Scheduled”, which accounts for 23.19% of the flow runs in the last 28 days. The table on the right shows the runs it found in more detail (here ordered on number of runs).
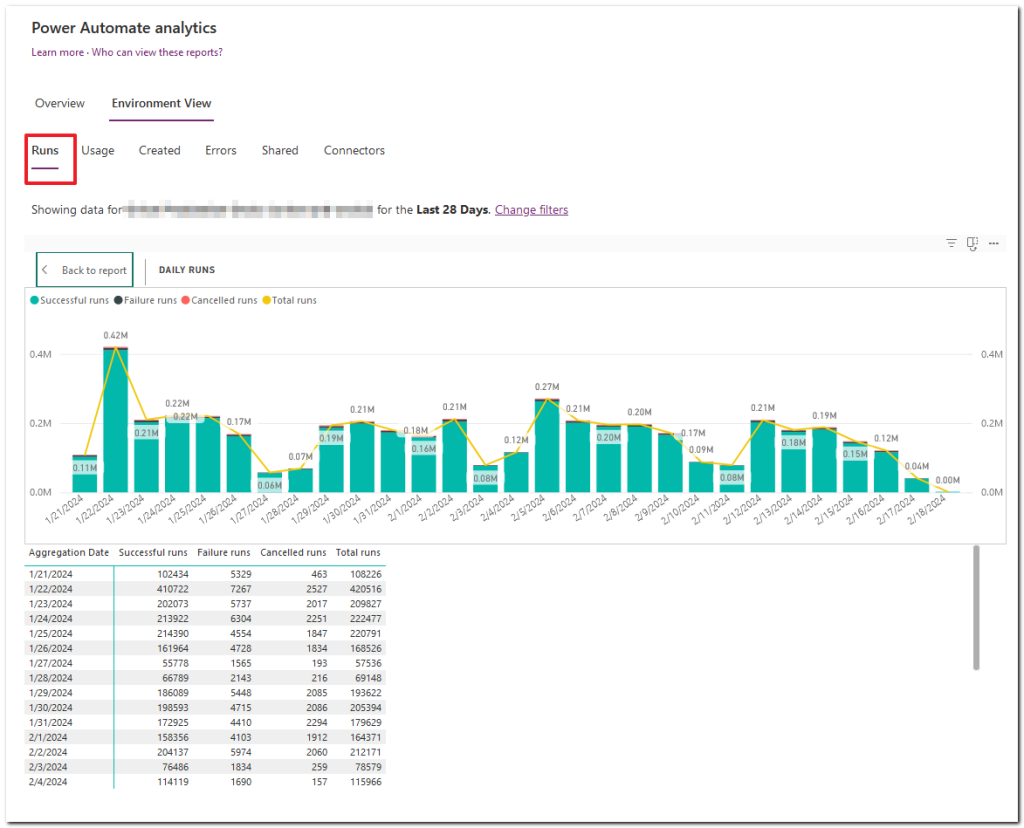
Cloud flow runs
Under the Runs tab, you get a timeline which shows the number of flow runs and their states. As this is not going into specific flows, it does give an overall impression of how the flows are performing.
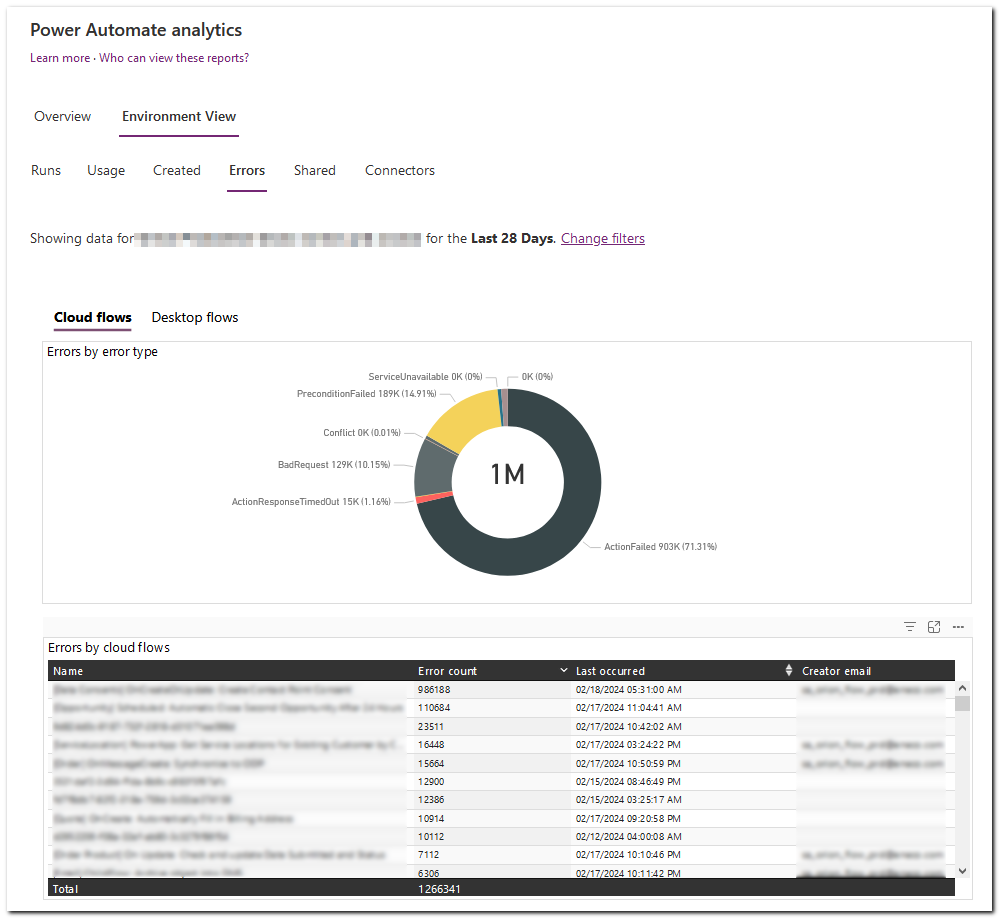
Cloud flow errors
Under the Errors tab, you will see which flows are performing badly and how often.
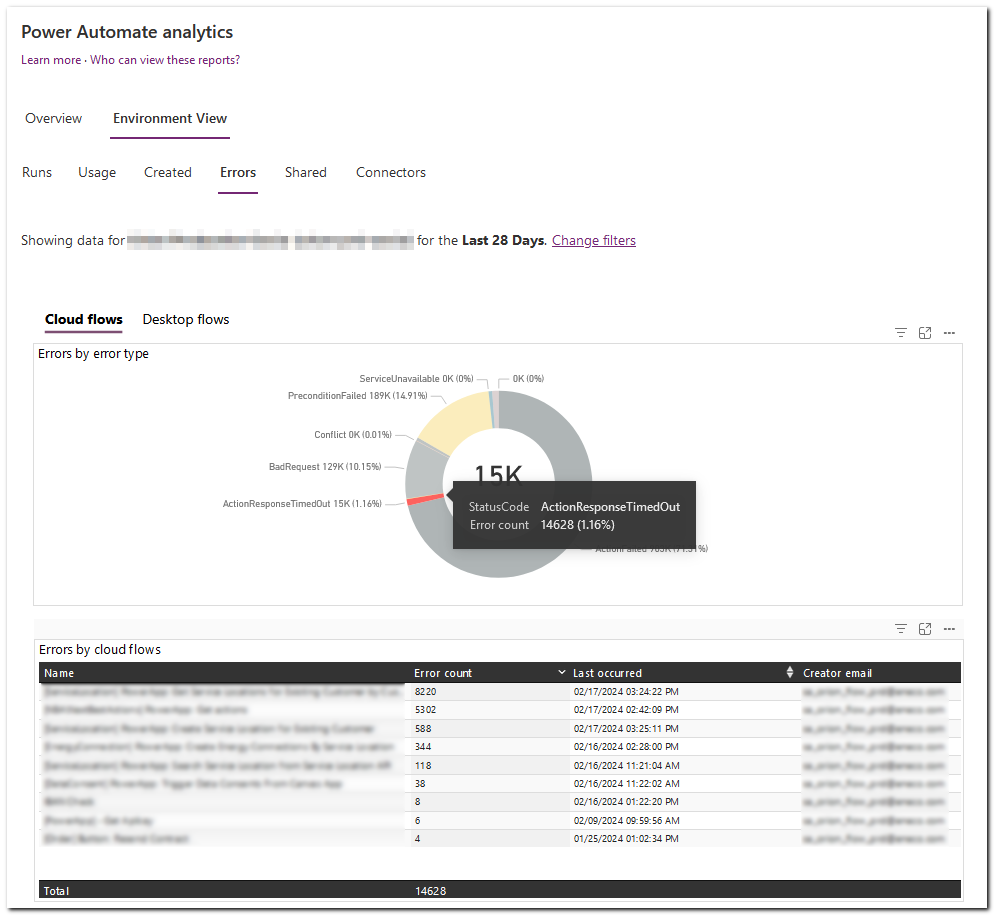
Of course you can focus on a specific error, like in the example on ActionResponseTimedOut.
Best used for
The current version of Power Automate Analytics gives some overview on a high level, but filtering is very limited. This tool will improve over time, as AI will be added.
3. Using XRM Toolbox and Flow Execution History
Within XRM Toolbox you can install a plug-in called Flow Execution History, which allows for easier viewing of the history of one or multiple Cloud flows simultaneously. Selecting a specific time window is very easy. Even filtering on the trigger output columns is possible.
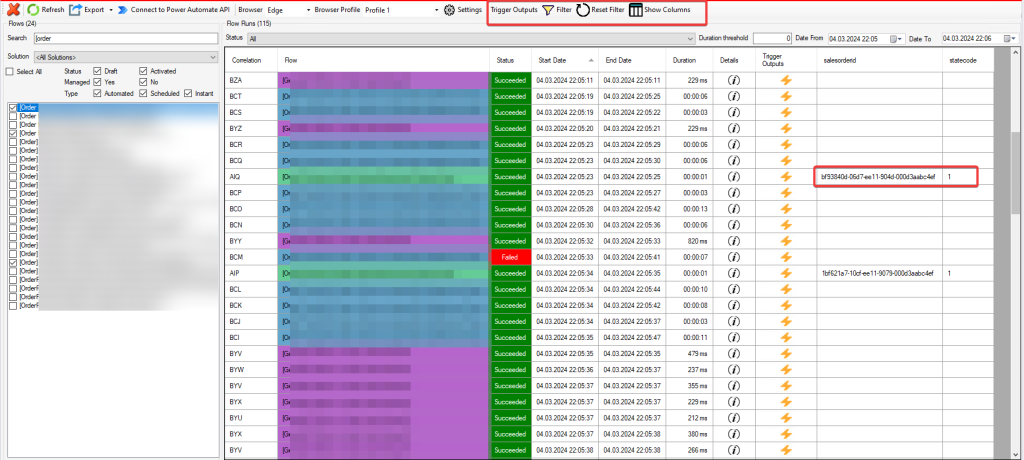
Viewing runs of multiple flows
In this example a few trigger output columns are shown, which makes it very easy to spot the correct flow run. Since other flows are also shown within the time window, relations between flows is visible.
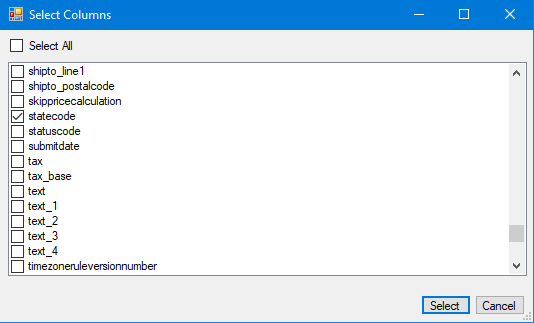
Selecting trigger output columns per flow
You can select which trigger output columns to show for each flow.
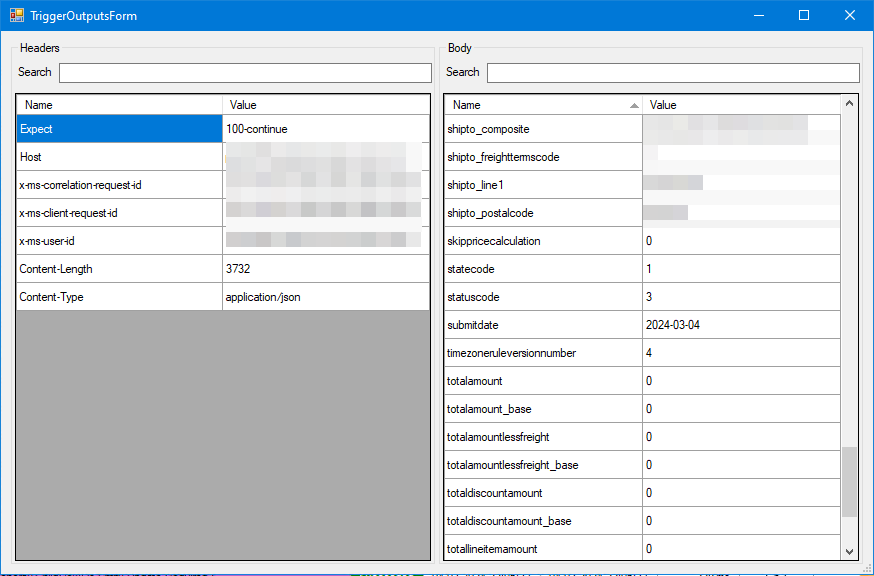
Inspecting the trigger outputs of a flow run
Clicking on the Trigger Outputs icon for a specific flow run, shows its values.
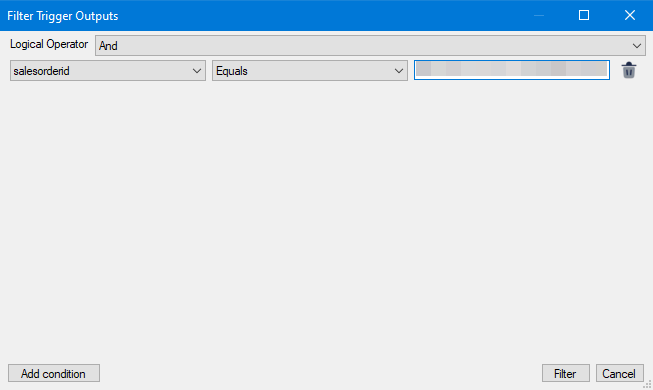
Filtering on trigger output
You can set a filter on the trigger output columns to limit the flow runs, which is very powerful.
Best used for
This plug-in is very helpful when you need to analyse a problem within a Cloud flows at some point in time. Filtering on date and time, and even on output trigger columns, makes this process a lot easier. Especially as the flow history in the browser is very slow and only offers filtering on flow run states. The biggest advantage is the possibility of selecting multiple flows, and see dependent flow runs.
4. Using Application Insights
If you’re familiar with Azure, you probably heard about Application Insights, which is used in Web Apps, Web APIs, Function Apps, etc. Though still in preview, Power Automate also offers this feature.
Read about this feature in a separate article. Go to article
Conclusion and expectations
Multiple possibilities are available to monitor on Power Automate Cloud flows, expecting more in the near future. Which is best for you, depends on the requirements you have. You don’t need to limit yourself to just one possibility, as they can be used side by side.