

If you’re interested in Power Automate Analytics and other monitoring options, check this article.
It is good to know if your cloud flows are running as expected, without issues. But, how do you know? Currently, there’s no real dashboard to monitor the cloud flows. So, let’s use the Data Export option to export flow runs into Azure Application Insights, which can be included into an Azure Dashboard.
Let’s start
The data export of flow runs is an OOTB option within Dynamics CRM, and has better performance than a self-built function app which use APIs. This OOTB option actually picks up all the runs. Alas, it does currently only show the guids of the runs, which is not very informative. BUT with some of Kusto Query Language, I wrote some queries which are now used to find bad performing or failing runs.
This option is currently in Public Preview for both Managed and Unmanaged environments.
It will initially become GA for Managed environments, for Unmanaged environments it might be as well. Microsoft has not yet decided.
Please upvote this idea to have this functionality kept on Unmanaged Environments as well!
Other previews will arrive this year, like table Flow Runs, which will contain flow run metadata. Also Power Automate Analytics will receive AI updates.
Setting up
Prerequisites:
- an Azure Application Insights instance for the Data Export
- You must be a member of one of these roles: Power Platform admin, Dynamics 365 admin, or Microsoft 365 Global admin.
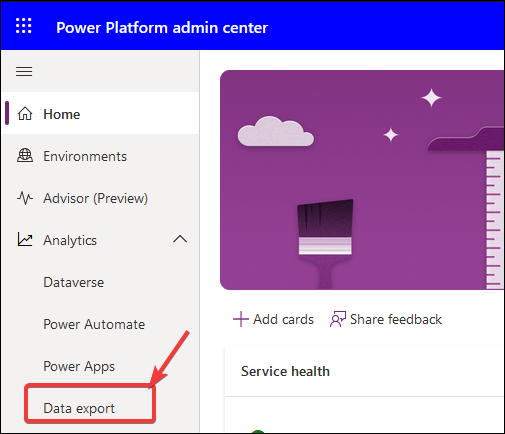
Power Platform Admin Center
Go to https://admin.powerplatform.microsoft.com/home
- Under tab “App Insights”, you will find existing data exports
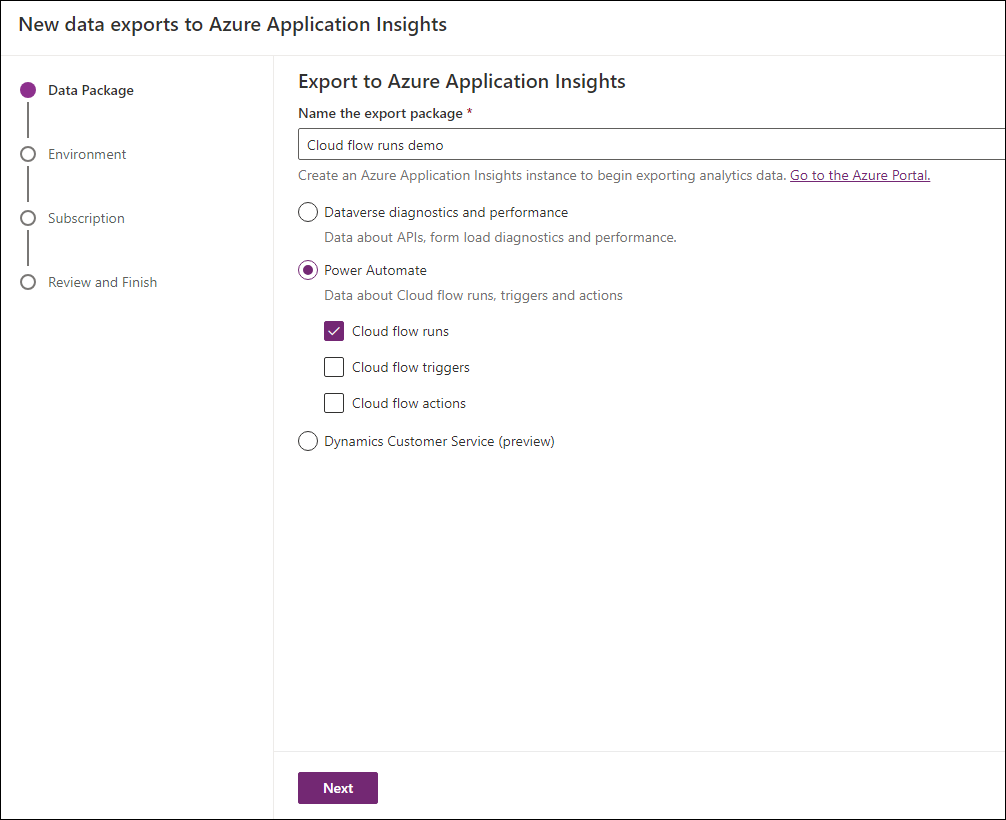
- Select “+ New data export”
- Select “Power Automate”, and check only “Cloud flow runs” to limit the amount of storage needed
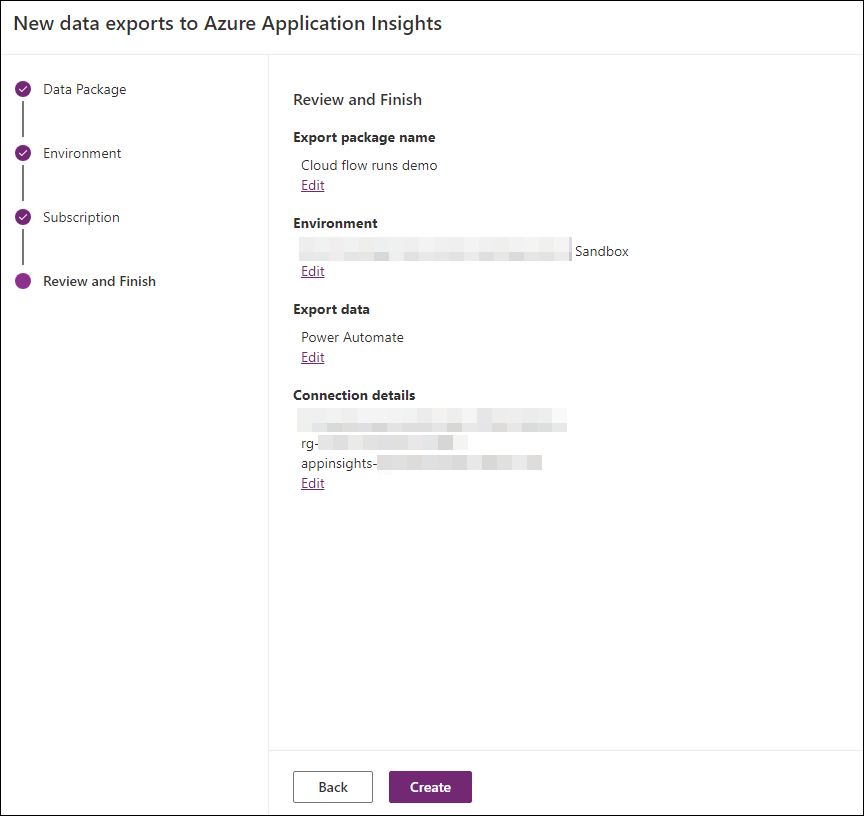
- Name the export package, eg. “Cloud flow runs demo”
Press “Next”.
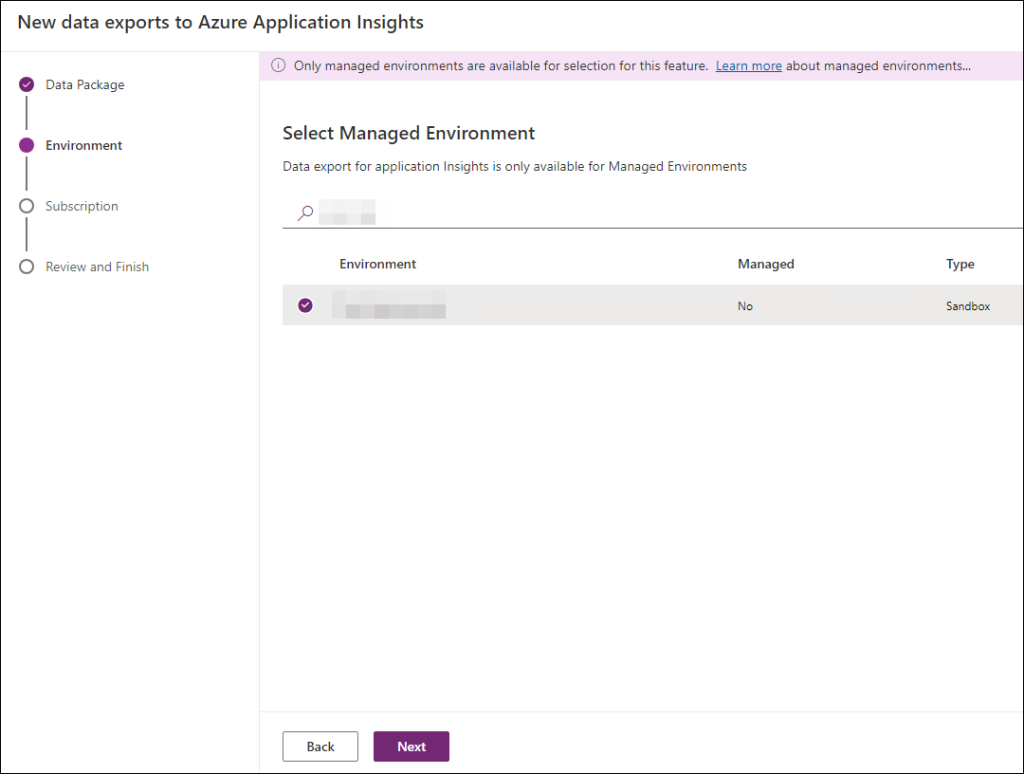
Now, you select a (managed) environment which contains the cloud flows.
Press “Next”.
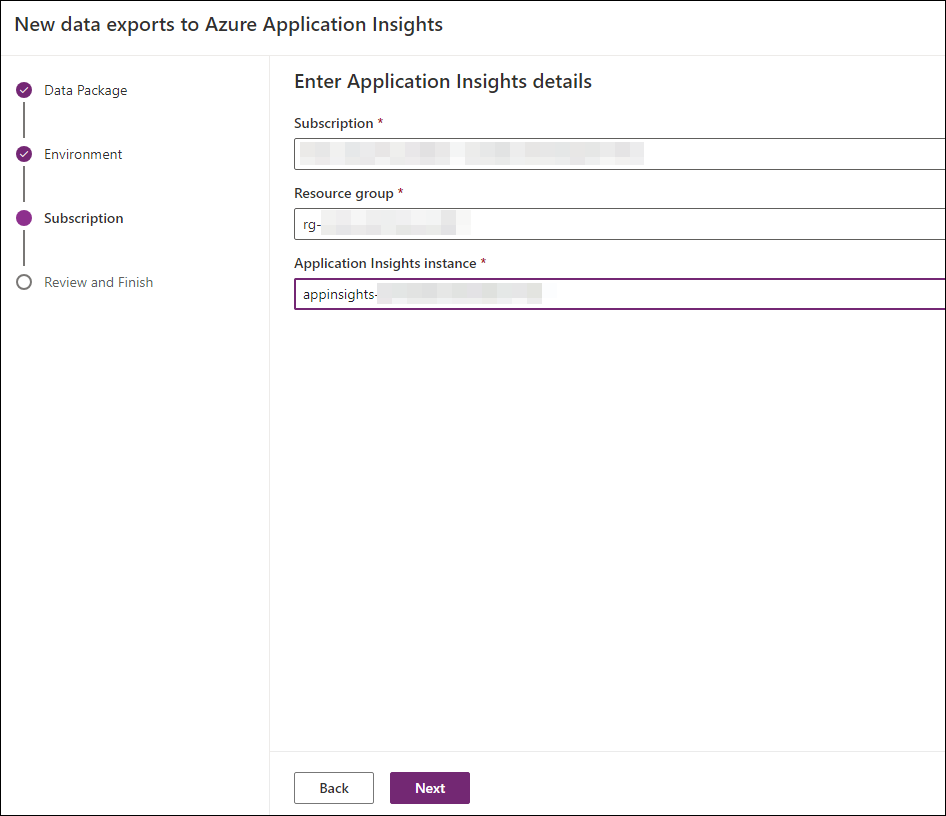
Now, refer to your existing Application Insights instance, and select it here.
Press “Next” for the last step.
Now, you can review your settings.
Press “Create” to start the Data Export.
It will take several minutes or hours, depending on the amount of cloud flow runs that are present in the select instance.
Checking Application Insights
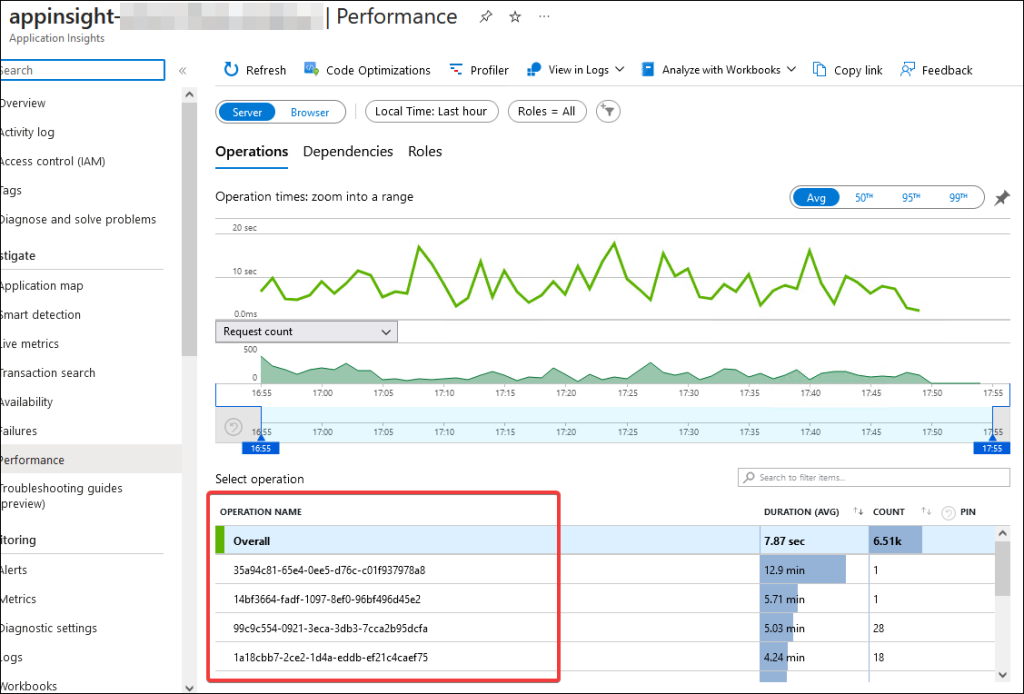
If you go to your Application Insights resource, and check Performance, you will see the flow runs showing up. Alas, it doesn’t show the names of the flows but just their guids.
O dear. Worry not, I have found a better way. Read on.
Better way to monitor
Now you can create queries using KQL (Kusto Query Language) to get a good overview of the flow runs.
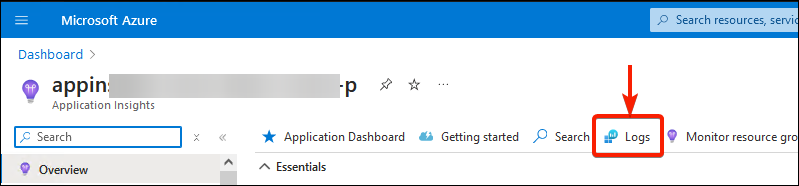
First go to your Application Insights resource to which Data Export was done. Click on Logs.
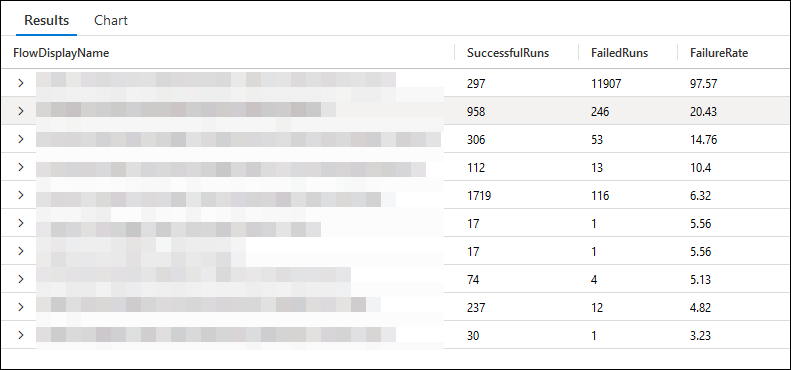
Example 1 – Top 10 of flows which have the highest failure rate
let dataset = app("appinsight-my-flowruns-test").requests
| where resultCode != "Other";
dataset
| extend FlowDisplayName = tostring(parse_json(tostring(customDimensions.Data)).FlowDisplayName)
| project FlowDisplayName, success
| summarize SuccessfulRuns = countif(success == true), FailedRuns = countif(success == false) by FlowDisplayName
| where FlowDisplayName != ""
| extend FailureRate = round((todouble(FailedRuns)/(FailedRuns+SuccessfulRuns)) * 100, 2)
| top 10 by FailureRate
Output shows which flows need your attention.
Example 2 – Failing cloud flow runs for specific cloud flow
app("appinsight-my-flowruns-test").requests
| where timestamp > todatetime("2024-04-30 11:00") and timestamp < todatetime("2024-04-30 12:00") // Specify UTC times !
| extend FlowDisplayName = tostring(parse_json(tostring(customDimensions.Data)).FlowDisplayName)
| extend FlowRunUrl = strcat("https://make.powerautomate.com/environments/",tostring(customDimensions.environmentId),"/flows/",tostring(customDimensions.resourceId),"/runs/",tostring(parse_json(tostring(customDimensions.Data)).RunId))
| project timestamp, FlowDisplayName, success, duration, FlowRunUrl, resultCode
| where success == false and resultCode != "Other"
| where FlowDisplayName contains "Some important cloud flow" // CHANGE THIS TO SEARCH FOR SPECIFIC FLOW
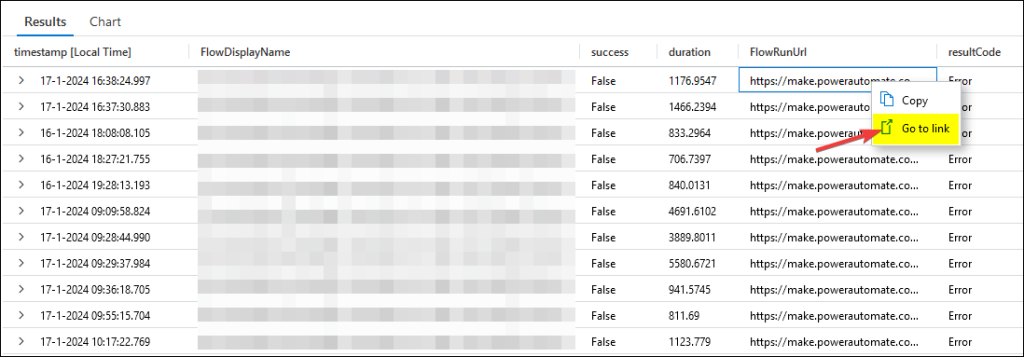
| order by timestamp ascOutput shows something like this. You can easily right-click on the FlowRunUrl to go straight to the failing flow.
Finding flow runs within specific time frame
You can also use this query for finding flow runs within a specific time frame which have not failed, but are interesting to investigate because you know something went wrong. Just comment out this line:
//| where success == false and resultCode != "Other"Conclusion
The Data Export Analytics gives you the opportunity to use Azure’s Application Insights to have great monitoring capabilities. By putting these queries in your Azure dashboard, you will have better overview and search options.